We feel investors should have an information outlet for the financial markets that is thorough, but does not require a prerequisite degree in economics. We hope this makes our commentary informative and educational for all levels of investors.
Quarter in Review
| Asset Class† | 1st Quarter 2019 Return | Past 12 Months |
| U.S. Small Cap Stocks | 14.6% | 2.1% |
| U.S. Large Cap Stocks | 13.7% | 9.5% |
| International Stocks | 10.3% | -4.2% |
| Commodities | 6.3% | -5.3% |
| U.S. Bonds | 2.9% | 4.5% |
Talk about turning the page to a new year! January proved to be as euphoric for markets as December had been gloomy. Stock markets across the globe roared higher and with interest rates falling to their lowest levels in years, bonds also notched a positive return (bond prices increase as interest rates fall). The 1st quarter of 2019 was the best quarterly return for the S&P 500 in 9 years, a big surprise after the 4th quarter of 2018 which was the worst quarter for the S&P 500 in nearly 8 years.
Unemployment remains at near record low levels and inflation continues to be muted, creating a scenario where the Federal Reserve has signaled it is content with current interest rates. Indeed, after the Federal Reserve’s January meeting, officials noted that a pause in interest rate hikes posed ‘few risks’ for the U.S. economy, a welcome sign for stock investors worried that higher interest rates would act as a wet blanket to corporate profits.
Reflecting on the Jekyll & Hyde Markets
Given the aforementioned about-face in market results and sentiment, it is worth taking a gut-check on how these movements affect the psyche of investors and the pitfalls that can occur if market movements dictate an investment strategy. The contrast in the results of the stock market between 4th quarter 2018, with its swift decline and wild daily swings, and the 1st quarter 2019, with its slow and steady upward march, allows for a great demonstration on how to digest the results and not let them affect long-term planning. This is especially important in the context of market timing and also the application of behavioral economics.
Market Timing
If it was an easy way to predict on any given day or even week when a market is about to make a big move, the investment management industry would not exist. In reality, markets move in much larger cycles and the goal of most professional investors is to gauge the change in tide rather the size of individual waves. In times of high volatility, panicked reactions can prove even more costly to the investor as days of large declines are often followed by days of large rebounds.
The market had two swift declines of more than 3% in 2018, in mid-October and again in early December. Below are the results of those two periods:
| Period | # of 1% + positive days in 20 Trading Days After 3% decline | # of 1% + negative days in 20 Trading Days After 3% decline | Return 20 days following 3% decline | Return 40 days following 3% decline |
| Mid-October (10/10/18) | 7 | 4 | 1.0% | -5.5% |
| Early December (12/4/18) | 2 | 8 | -6.2% | .9% |
This table shows that in the 20 days following a 3% decline in 2018, the subsequent 20 days of trading were more volatile than normal with large moves in both directions. Furthermore, in these two instances from 2018, the medium-term results (weeks to months) played out in the opposite manner from October (positive after 20 days, but negative after 40) to December (negative results after 20 days, but positive results after 40 days). These varied results make finding the optimal re-entry point challenging, something required in successful market timing.
Behavioral Economics
The second significant issue with making investment decisions due to a decline is how the increase in volatility, which tends to rise significantly during periods of decline, affects human’s ability to react rationally. Over the years these Investment Letters have spoken extensively about the emergence of behavior economics–the basic idea that the science of economics cannot be fully explained by numbers since humans are not always rational. This is especially evident in periods of decline. The below chart shows the S&P 500 (U.S. stocks, in blue) against the VIX, which is an indicator of the level of volatility for the past year (in orange).
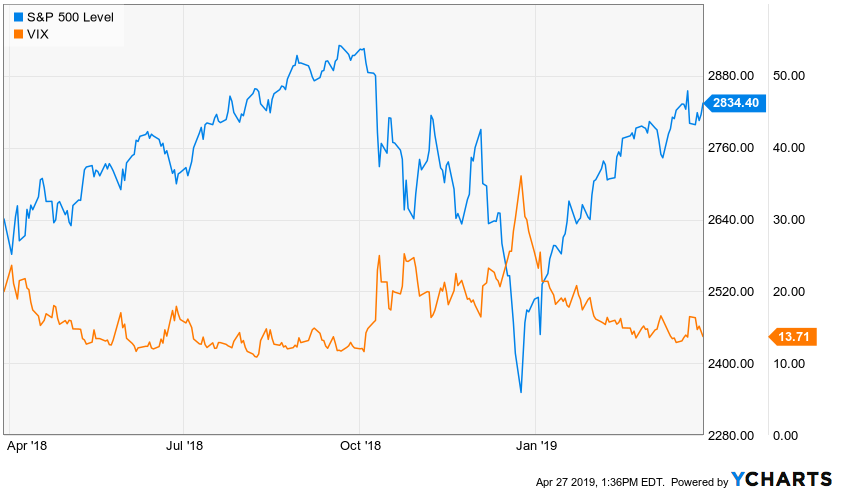
As the chart indicates, the market increased with low volatility, but decreased with high volatility. This behavior can play tricks with investors’ minds in many ways. In periods of steady increases, portfolio value increases may not be noticeable and less attention will be paid to the market by the media. Declines, however spark our fight or flight triggers as account values drop and fluctuate, while at the same time the market becomes front page news. This can create doubt and fear at an individual level that is simply not warranted for a long-term investment horizon.
Much like an athlete cannot replicate the emotions of a game in practice, investors cannot replicate the emotions encountered with a swift decline. This doesn’t mean investors can’t “practice” better. Take notes of your emotions during times of market declines or volatility and compare those notes to your emotions weeks or months later.
References and Links
Behavioral Economics – Here are a couple of links to articles discussing how behavioral economics interacts with investment decisions:
Opinion: 12 Things You Can Learn About Investing from Nobel Prize Winner Richard Thaler
How Investor Behavior Gets in the Way of Success
† Indices used to represent asset classes:
U.S Large Cap Stocks — S&P 500
U.S. Small Cap Stocks — Russell 2000
International Stocks — MSCI ACWI ex-U.S.
U.S. Bonds — Bloomberg Barclays Aggregate
Commodities — Bloomberg Commodity
Important Information
The information presented here is not specific to any individual’s personal circumstances.
To the extent that this material concerns tax matters, it is not intended or written to be used, and cannot be used, by a taxpayer for the purpose of avoiding penalties that may be imposed by law. Each taxpayer should seek independent advice from a tax professional based on his or her individual circumstances.
These materials are provided for general information and educational purposes and represents Wilson Capital’s views based upon publicly available information from sources believed to be reliable—we cannot assure the accuracy or completeness of these materials. The information in these materials may change at any time and without notice.
Wilson Capital is a Registered Investment Advisor (“RIA”), registered in the state of Massachusetts. Wilson Capital provides asset management and related services for clients nationally. Wilson Capital will file and maintain all applicable licenses as required by the state securities boards and/or the Securities and Exchange Commission (“SEC”), as applicable. Wilson Capital renders individualized responses to persons in a particular state only after complying with the state’s regulatory requirements, or pursuant to an applicable state exemption or exclusion.